Free Neurodiversity test
Neurodivergent Expression Profile™ (NEP)
Complete the Test
Read and rate below statements carefully. It will take only 3 -5 minutes to complete the test.
View Detailed Results
Learn about your areas of strength and weakness and get a full neurodivergence report.
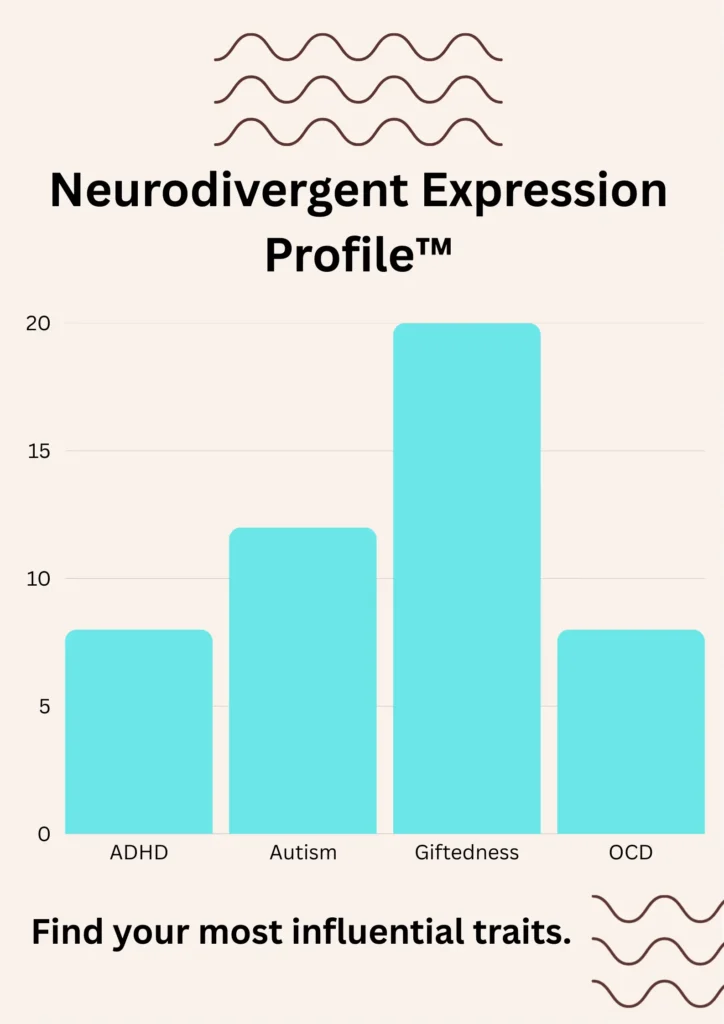
Find your most influential traits.
Find your most influential traits and understand their impact on your behavior and decisions.
Open
The Neurodivergent Expression Profile (NEP) is developed with transparency to support ethical research and peer review.
Free
NEP is freely accessible for individuals and researchers without paywalls or licensing barriers.
Research-Informed
NEP is grounded in contemporary neurodiversity and psychological research, emphasizing dimensional trait patterns.
Non-Diagnostic
NEP is not a diagnostic instrument and does not replace professional clinical evaluation.
What is the Neurodivergent Expression Profile™?
NEP is a self-screening assessment that helps you understand patterns in how you think, feel, and behave. Neurodivergent Expression Profile (NEP) is a self-report measure assessing multidimensional expressions of neurodivergent traits across cognitive, attentional, sensory, social, emotional, and behavioral domains.
What does my “Profile Code” mean?
Your Profile Code (e.g., OCD-DPX-DYC) summarizes the strongest trait patterns identified in your results.
Each letter group represents a neurodivergent trait profile
Codes are ordered from strongest to weaker expressions
A code of BAL means a more balanced or evenly distributed profile
The profile code is a descriptive summary, not a label.
What does the percentage score next to a type mean?
The percentage (e.g., OCD – 90%) shows how strongly your overall pattern aligns with that trait profile, based on your dimension scores.
Higher percentages = stronger trait expression
Lower percentages = weaker or less prominent expression
This does not mean severity or dysfunction.
What are the dimensions shown in the chart?
The test measures six core dimensions:
Cognition – how you process information and think
Attention – how you focus, shift, and sustain attention
Sensory – how you experience sensory input
Social – how you engage with others
Emotion – how you experience and regulate emotions
Behavior – how you prefer structure, routines, and control
Each dimension is scored independently.
How should I interpret high or low dimension scores?
There are no “good” or “bad” scores.
Higher scores indicate stronger expression of that trait
Lower scores indicate more typical or flexible patterns
For example:
High Sensory = heightened sensitivity or awareness
High Behavior = preference for structure and predictability
How Reliable Are the Scores?
The NEP™ uses:
Balanced item wording (including reverse-scored items)
Multi-dimensional scoring
Percentage normalization for fair comparison
These features improve reliability, but no self-report tool is 100% accurate.
Country-Level Summary of Neurodivergent Trait Expression
| Country | Participants (N) | Elevated Trait Expression (%) |
|---|---|---|
| At | 1 | 100% |
| Br | 1 | 100% |
| Cn | 2 | 0% |
| Finland | 10 | 10% |
| Germany | 24 | 79.2% |
| India | 130 | 44.6% |
| Nl | 1 | 100% |
| United Kingdom | 1 | 100% |
Note: Percentages represent aggregate trait expression and are not diagnostic.
Neurodivergent Expression Profile™
Neurodivergent Expression Profile scale helps you understand your unique traits, thinking style, and behavioral patterns through a simple, research-based assessment.